Stop wasting hours searching for bugs. Master these eight Chrome debugging techniques to identify issues faster, streamline your workflow, and become a more efficient frontend developer.

Introduction
Debugging is part of every developer’s life, but it doesn’t have to be painful. If you’ve ever spent hours hunting down a tiny bug, you know how frustrating it can be.
Chrome DevTools is more than just an “inspect element” tool; it’s a complete suite for debugging, profiling, and analyzing your web apps. When used effectively, it can save you hours and drastically reduce frustration.
In this article, we’ll go over eight methods to debug faster in Chrome, from basic features you might be ignoring to advanced techniques that make problem-solving almost painless.
1. Use Breakpoints Effectively

Breakpoints pause your code so you can inspect variables and call stacks.
How to Use:
- Open DevTools → Sources tab → Click the line number to set a breakpoint.
- Right-click for conditional breakpoints (only pause when a condition is true).
// Example
if (user.isAdmin) {
  showAdminPanel();
}
Tip: Conditional breakpoints reduce unnecessary pauses when debugging loops or frequently called functions.
2. Leverage console.* Methods Beyond console.log

Many developers stick to console.log(), but Chrome has more tools:
console.error()→ Highlights errors in redconsole.warn()→ Marks warningsconsole.table()→ Displays arrays/objects in a readable tableconsole.time()/console.timeEnd()→ Measure execution time
console.time('fetchData');
fetchData();
console.timeEnd('fetchData');
Benefit: Quick insights into performance and structure without pausing code execution.
3. Use the Watch Panel and Scope Inspection

While paused at a breakpoint, Chrome lets you:
- Inspect local, closure, and global variables
- Add variables or expressions to the Watch panel to monitor changes in real-time
Tip: Use this when debugging tricky state changes in React or vanilla JS apps.
4. Step Through Code
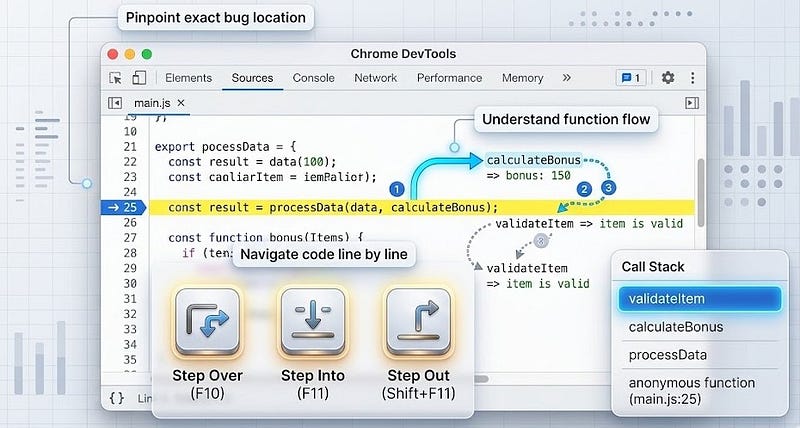
Chrome allows you to move line by line or jump over functions:
- Step Over (F10): Execute the next line without diving into function calls
- Step Into (F11): Dive into a function call
- Step Out (Shift+F11): Exit the current function
Benefit: Pinpoint exactly where a bug originates instead of guessing.
5. Use the Network Tab for API Debugging

Many frontend bugs are backend-related. Chrome’s Network panel helps you:
- Inspect requests/responses
- View HTTP headers and status codes
- Replay or modify requests
Tip: Filter by XHR/Fetch requests for cleaner debugging of API calls.
6. Utilize the Performance Tab
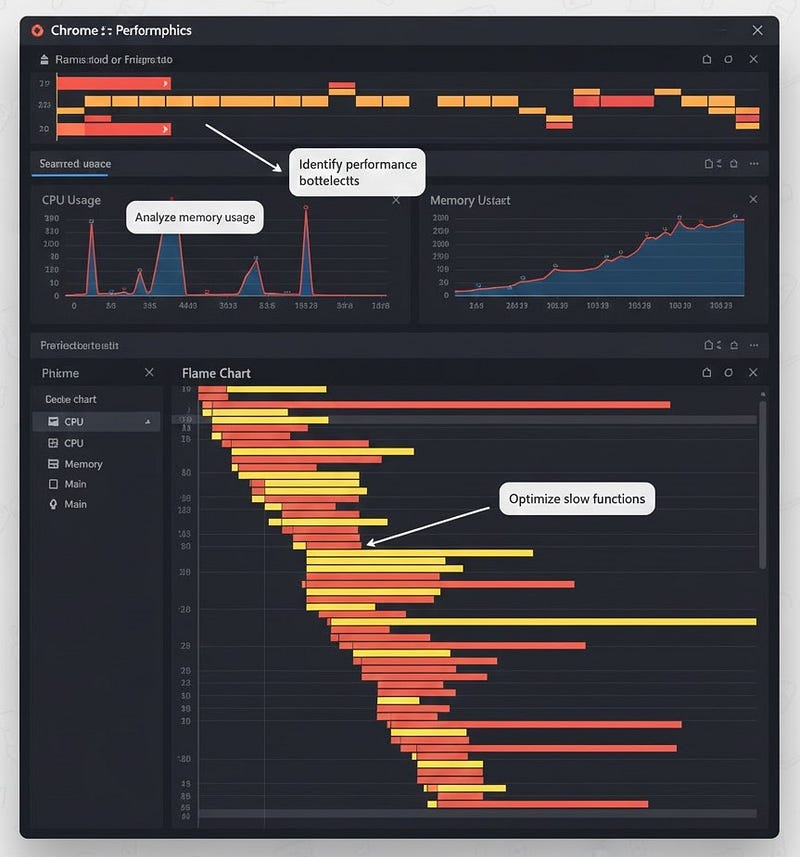
For slow apps or animations, the Performance tab is your best friend:
- Record a session while reproducing the issue
- Analyze CPU usage, call stacks, and memory allocation
- Identify bottlenecks causing lag
Tip: Look for repeated function calls or long-running tasks that block the main thread.
7. Experiment with Snippets
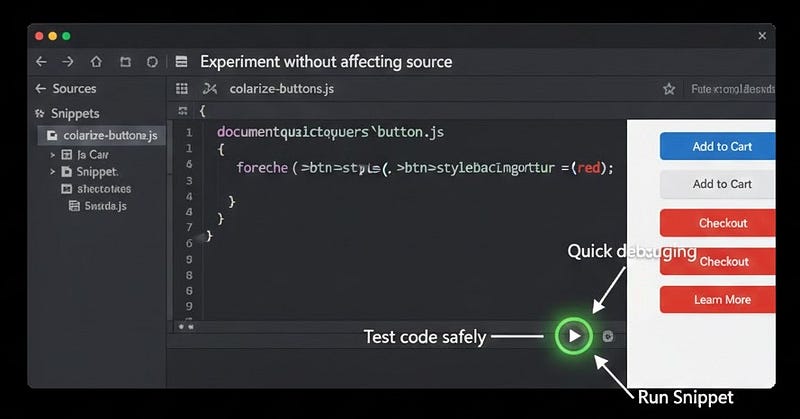
Chrome DevTools allows you to write and run snippets of JS:
- Go to Sources → Snippets → New Snippet
- Write small test scripts and execute them on any page
// Example snippet
document.querySelectorAll('.btn').forEach(btn => btn.style.backgroundColor = 'red');
Benefit: Safe, quick testing without touching your source code.
8. Use Blackboxing for Third-Party Libraries
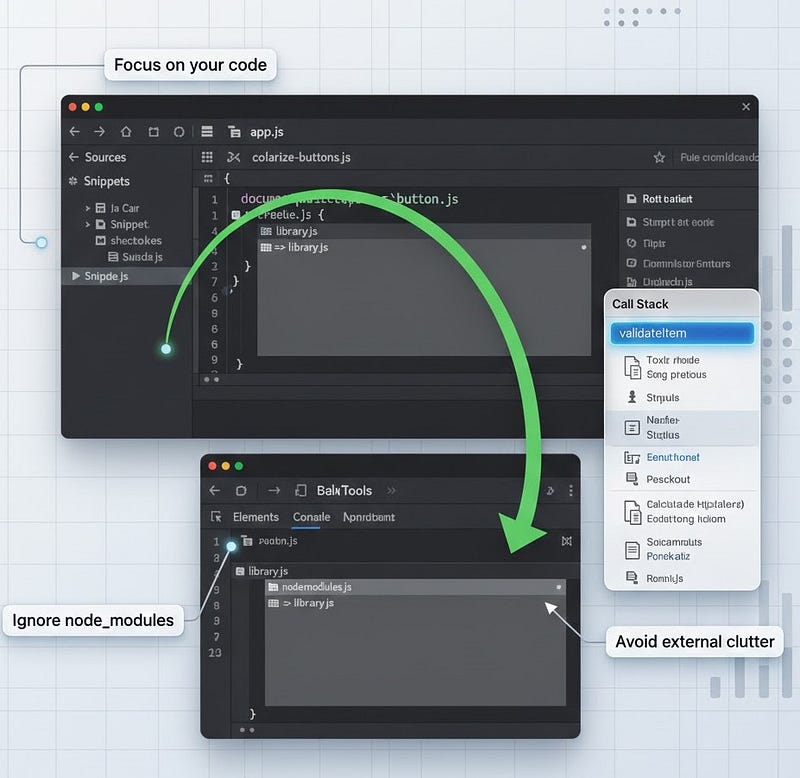
Sometimes bugs aren’t in your code; they’re in a library you don’t control. Blackboxing prevents stepping into these scripts when debugging:
- Right-click the library file in Sources → Blackbox Script
- Chrome skips these files during step-through debugging
Benefit: Focus only on your code and avoid getting lost in node_modules or external libraries.
Key Takeaways
- Breakpoints are powerful; use conditional breakpoints to save time
- Explore
console.error,console.warn,console.table, and timers - The Watch panel lets you track variables without logging every change
- Step through code to pinpoint the exact line causing issues
- Network panel = inspect API issues without guessing
- Performance tab = identify slowdowns and memory leaks
- Snippets = test code quickly without touching production files
- Blackboxing = ignore external libraries while debugging
Next Steps
- Practice using conditional breakpoints in your daily workflow
- Explore Performance recordings on a slow-loading page
- Create snippets for common debugging tasks
- Combine these techniques to reduce debugging time by hours each week
Strong Call to Action:
Open Chrome DevTools now, pick one of these eight methods, and try it on your current project. Debugging doesn’t have to be painful; it can be fast, precise, and even enjoyable. Master these tools and your future self (and your users) will thank you.


Leave a Reply