See exactly how small JavaScript optimizations improve performance with practical before-and-after comparisons you can apply immediately.

Introduction
JavaScript performance issues rarely come from one massive mistake.
They come from small inefficiencies repeated thousands of times:
- Too many DOM updates
- Uncontrolled event handlers
- Heavy initial bundles
- Poor data structure choices
The good news?
You don’t need a full rewrite.
Below are 7 practical JavaScript optimizations, each with a clear Before vs After comparison so you can see exactly what improves and why.
1. Batch DOM Manipulations
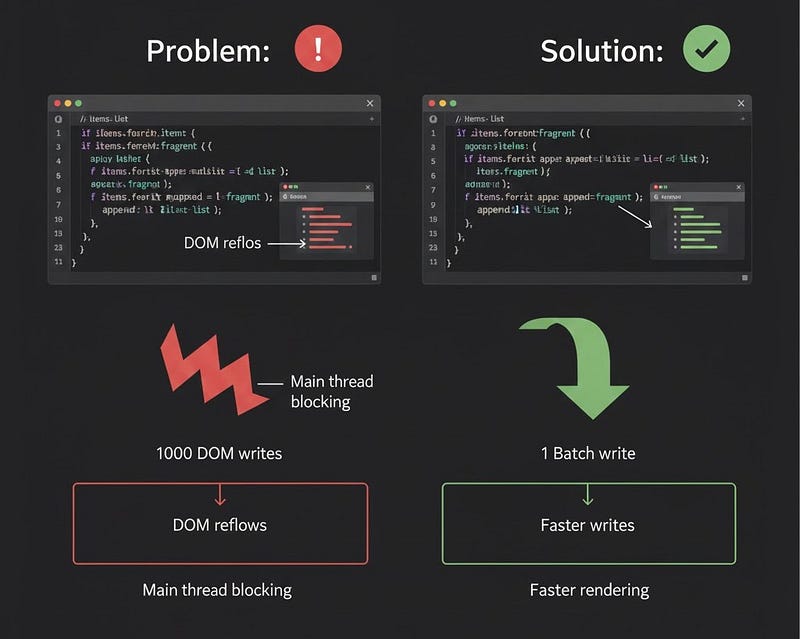
Before: Repeated DOM Writes
const list = document.getElementById('list');

items.forEach(item => {
  const li = document.createElement('li');
  li.textContent = item;
  list.appendChild(li);
});
Why It’s Slow
- 1000 items = 1000 DOM updates
- Causes layout recalculation (reflows)
- Blocks the main thread
After: Use DocumentFragment
const list = document.getElementById('list');
const fragment = document.createDocumentFragment();

items.forEach(item => {
  const li = document.createElement('li');
  li.textContent = item;
  fragment.appendChild(li);
});

list.appendChild(fragment);
Performance Impact
- 1 DOM update instead of 1000
- Dramatically fewer reflows
- Faster rendering for large lists
Key Concept: Batch writes to the DOM whenever possible.
2. Debounce Expensive Event Handlers

Before: Heavy Resize Handler
window.addEventListener('resize', () => {
  calculateLayout();
});
Resize can fire dozens of times per second.
After: Debounced Resize
function debounce(fn, delay) {
  let timeout;
  return (...args) => {
    clearTimeout(timeout);
    timeout = setTimeout(() => fn(...args), delay);
  };
}

window.addEventListener('resize', debounce(() => {
  calculateLayout();
}, 200));
Performance Impact
- Instead of 100+ calls → 1 call after resizing stops
- Reduced CPU spikes
- Smoother UI
Use Debounce When: You want action after the event ends.
3. Prevent Memory Leaks

Before: Forgotten Event Listener
const button = document.getElementById('btn');

button.addEventListener('click', () => {
  console.log('Clicked');
});
If the button gets removed, the listener may remain in memory.
After: Clean Up Properly
function handleClick() {
  console.log('Clicked');
}

button.addEventListener('click', handleClick);

// Later
button.removeEventListener('click', handleClick);
Performance Impact
- Lower long-term memory usage
- Prevents slowdowns in single-page applications
- Avoids hidden performance degradation
Optimization isn’t just speed; it’s stability over time.
4. Optimize Loops in Large Data Sets
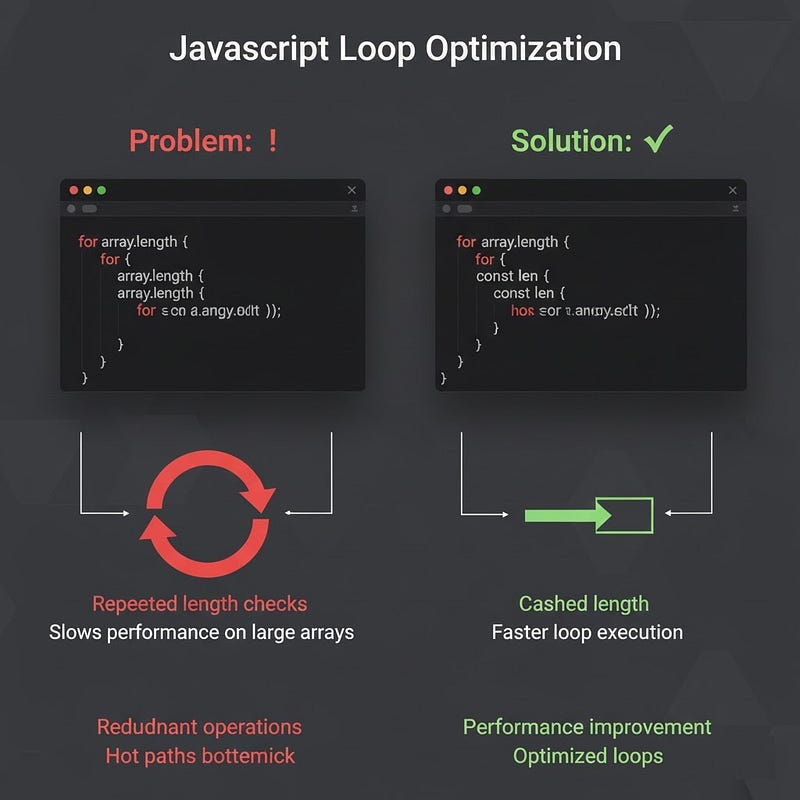
Before: Recalculating Length
for (let i = 0; i < array.length; i++) {
  process(array[i]);
}
array.length is accessed each iteration.
After: Cache Length
const len = array.length;
for (let i = 0; i < len; i++) {
  process(array[i]);
}
Performance Impact
Small improvement per loop.
Huge improvement when iterating over millions of elements.
Also consider:
for (const item of array) {
  process(item);
}
Readable + optimized in modern engines.
Micro-optimizations matter in hot paths.
5. Lazy Load Heavy Features

Before: Load Everything Upfront
<script src="analytics.js"></script>
<script src="heavyChartLibrary.js"></script>
Even if users never use charts.
After: Dynamic Import
button.addEventListener('click', async () => {
  const module = await import('./heavyChartLibrary.js');
  module.renderChart();
});
Performance Impact
- Faster initial load time
- Reduced bundle size
- Better Lighthouse score
Load only what the user needs. When they need it.
6. Replace Arrays with Sets for Fast Lookups
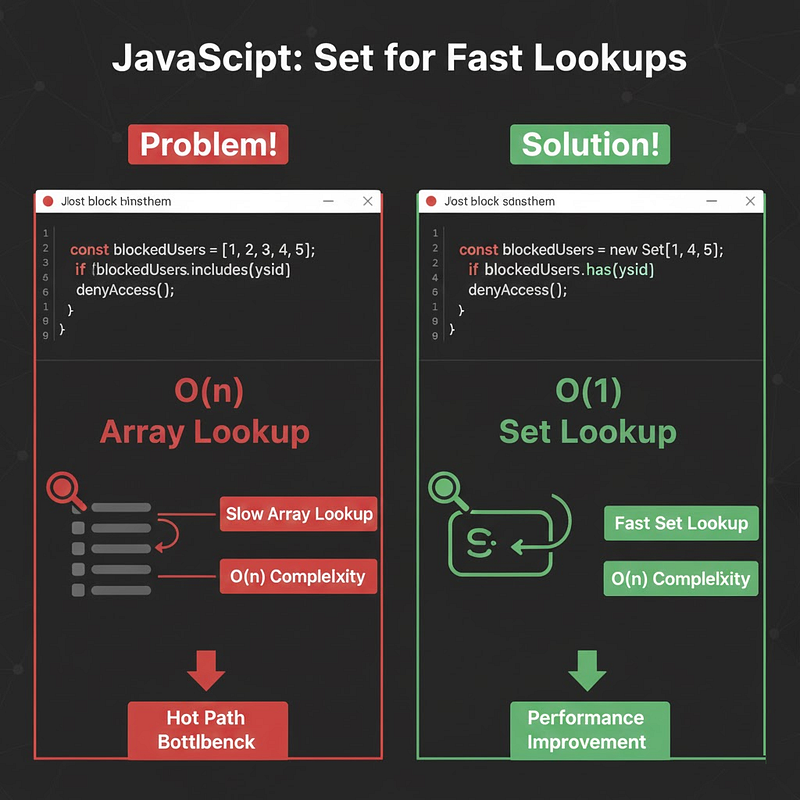
Before: Slow Lookup in Array
const blockedUsers = [1, 2, 3, 4, 5];

if (blockedUsers.includes(userId)) {
  denyAccess();
}
Time complexity: O(n)
After: Use Set
const blockedUsers = new Set([1, 2, 3, 4, 5]);

if (blockedUsers.has(userId)) {
  denyAccess();
}
Time complexity: O(1)
Performance Impact
Noticeable improvement when checking membership thousands of times.
Choose data structures intentionally.
7. Minify & Tree-Shake Your Bundle
Before: Shipping Development Build
- Unminified code
- Unused imports
- Large source maps
- Debug logs
After: Production Build with Tree-Shaking
Using tools like:
- Vite
- Webpack
- Rollup
- Esbuild
These tools:
- Remove unused code
- Minify output
- Optimize modules
Performance Impact
- Smaller bundle size (sometimes 30–70% smaller)
- Faster download
- Faster parse & execution
What you don’t ship can’t slow you down.
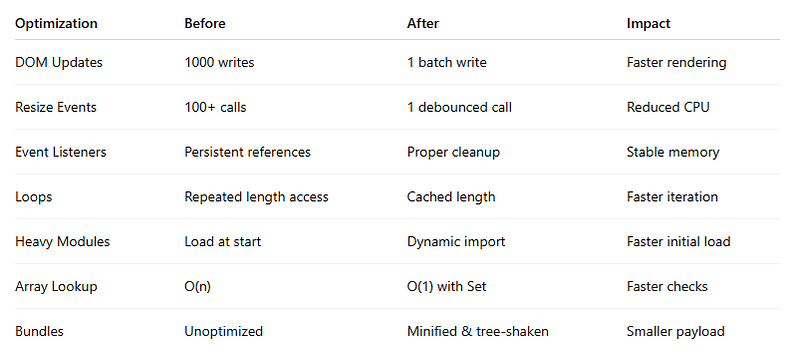
Performance Summary Table
How to Measure Improvements
Don’t optimize blindly.
Use:
- Chrome DevTools Performance tab
- Lighthouse audits
- Network panel
- Memory snapshots
console.time()for micro-measurements
Example:
console.time("process");
processLargeArray();
console.timeEnd("process");
Measure → Optimize → Measure again.
Key Takeaways
- Batch DOM operations
- Debounce expensive events
- Clean up memory
- Optimize hot loops
- Lazy load heavy features
- Choose better data structures
- Ship smaller bundles
JavaScript optimization is rarely about one big trick.
It’s about eliminating friction in small places.
What You Should Do Today
Pick just one:
- Replace array lookups with
Set - Add debounce to scroll/resize handlers
- Convert a heavy import to a dynamic import
- Remove unused dependencies
- Profile your largest component
You’ll likely see measurable improvement within an hour.
Strong Call to Action
If you care about frontend performance, start applying one of these optimizations today and measure the difference.
Then share this with a developer who says:
“JavaScript performance doesn’t matter that much.”
Because fast JavaScript doesn’t just feel better.
It converts better.
It scales better.
It wins users.


Leave a Reply